
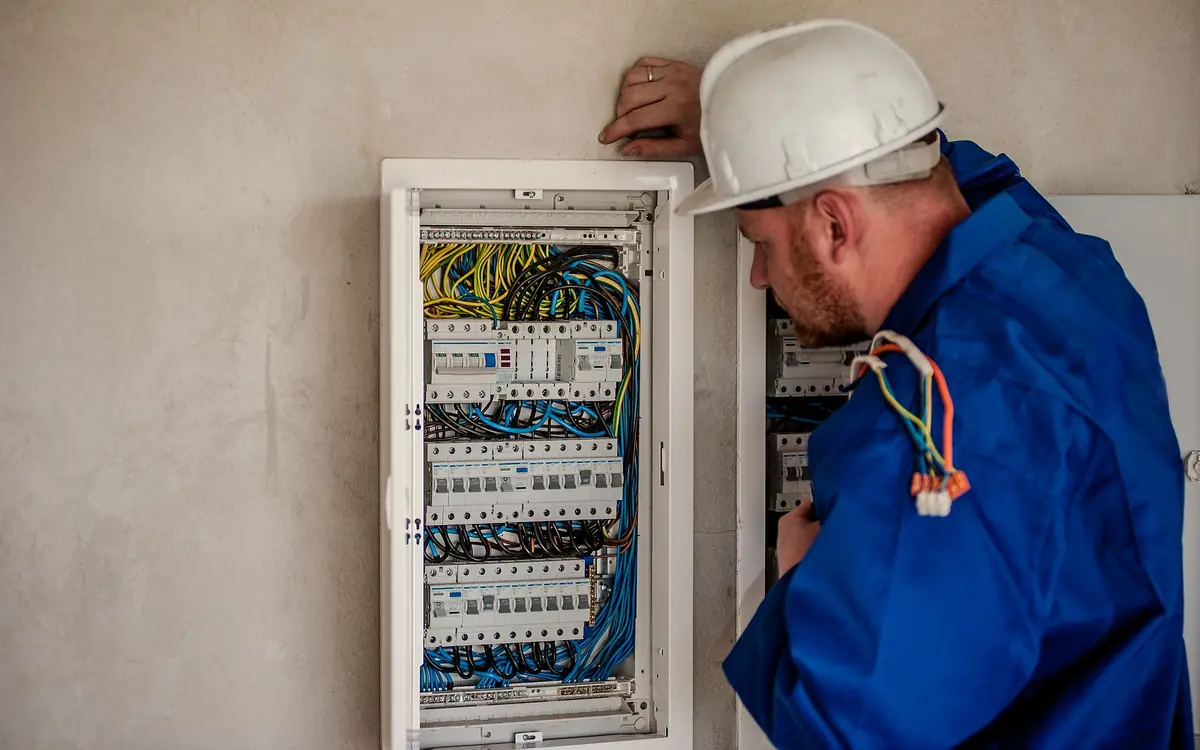
A bill that doubled with nothing new plugged in
The bill is roughly twice the last one and the house is the same house — same occupants, same appliances, nobody moved in and nothing was bought. The instinct is to go round switching things off at the wall, and it is the wrong instinct, because the money on that document is the product of two independent numbers and only one of them is about the building. Price times quantity. Pulling them apart takes five minutes and no instruments: ignore the money and find the kilowatt-hours, this period's and the same period a year ago, then divide each by the days it covers, because ninety-two days against seventy-eight is eighteen per cent more energy at an identical daily rate. If daily kilowatt-hours are flat and the money doubled, the building is innocent and the fault is commercial — a fixed contract that ended, a standing charge that rose, a discount that expired, a transfer onto a deemed rate after a supplier change. Insulating a house to fix a pricing problem is the most expensive available way to be wrong, and it happens every winter.
If daily consumption genuinely moved, four candidates remain and they leave distinguishable marks. Weather is the commonest by a wide margin: a house with any electric heat can double its draw in a cold spell with not one habit changed. A new large load is second, and it usually announces itself by starting on a date somebody can name. Third is something stuck permanently on — an immersion thermostat welded closed, an underfloor mat energised beneath a rug laid in October, trace heating that never left frost mode. Fourth is the reading itself, where an estimate followed by a true read drops months of catch-up into one document; rule that one out first, because it is the only entry on the list that costs nothing to test.
| What changed | Daily kWh against the same weeks last year | What settles it |
|---|---|---|
| A fixed contract ended, or the standing charge and unit rate moved | Unchanged, or close enough that the difference is weather | The unit rate and standing charge printed on both bills, compared line against line rather than as totals |
| An estimated read corrected by an actual one | Implausibly high for one period, then implausibly low for the next | The read type beside each figure, and a reading taken today against the closing figure the bill charged to |
| Weather, in any house with electric space or water heating | Up, and tracking the outdoor temperature day for day | Daily consumption plotted against daily mean outdoor temperature — the slope is heating, the intercept is everything else |
| A large new load that started on a specific date | Up as a step, from a day somebody in the house can name | The half-hourly series either side of that day, and asking who bought what |
| Something stuck permanently on | Up by a flat amount, day and night, weekends and holidays alike | The overnight minimum, which a fault raises and a change in behaviour does not |
Weather is not behaviour, and degree days are how you tell them apart
The most useful thing that can be done with a year of consumption data costs nothing, appears on no bill, and takes twenty minutes in a spreadsheet. Take daily kilowatt-hours from the smart meter data or the supplier portal, take daily mean outdoor temperature from the nearest published station, and plot one against the other with temperature on the horizontal axis. What comes back is the house's energy signature, and it is the closest thing a domestic building has to a diagnostic trace.
It has a shape, and the shape is the finding. Above some outdoor temperature the points settle into a horizontal band: the consumption that does not care what the weather does — lighting, cooking, refrigeration, electronics, laundry, hot water, and the standing draw of everything never switched off. Below it, they climb along a line whose steepness is the heating. Intercept and slope are separate quantities with separate remedies, and almost every wasted retrofit pound is spent attacking one while the problem sits in the other. The slope, in kilowatt-hours per degree-day, measures envelope and heat source together, so identical slopes can mean opposite things: a leaky heat-pumped house looks gentler than a tight one on panel heaters, because one returns several kilowatt-hours of heat per kilowatt-hour bought and the other returns exactly one. The nameplate tells you which you have.
The base temperature — where the sloped line meets the flat band — is a property of the specific building rather than a convention, and this is where published degree-day series quietly mislead. North American series default to a base of 65 degrees Fahrenheit and British ones to 15.5 degrees Celsius, both inherited from buildings losing far more heat than a modern one does. CIBSE TM41 sets out how base temperature is chosen and what the analysis does when it is chosen badly; the ASHRAE Handbook chapter on energy estimating and modeling methods gives the degree-day and bin methods the same treatment from the design side. In practice the procedure is empirical: fit at several candidate bases and keep the one that straightens the line, because that temperature is telling you something real about internal gains and insulation.
Two cautions before the result is used. A house with air conditioning has two slopes and comes back as a V with a flat floor between the arms, most clearly where a heat pump runs in both directions. And a regression is only a baseline if it fits: ASHRAE Guideline 14 and the IPMVP both set out how a baseline model is judged before savings are calculated against it, and twelve monthly totals make a far weaker instrument than three hundred and sixty-five daily points.
The night floor, and how much of the year hides inside it
Now go the other way and look at the smallest number in the dataset. In a half-hourly series, find the lowest consumption recorded between roughly two and five in the morning across a normal week. That is what the house draws with everybody asleep and nothing being used on purpose, and it runs for all 8,760 hours of the year whether anybody is in the building or not. Double the half-hourly figure to get average kilowatts, multiply by 8,760, and in a house that does not heat, drive or make hot water on electricity the annual total that falls out is regularly the largest single line on the whole audit — and the one nobody has ever seen, because it never draws attention to itself.
The arithmetic is brutally simple, which is exactly why it gets ignored: one watt running continuously is 8.76 kilowatt-hours a year. Forty-five watts of always-on draw — a router, an optical network terminal, two set-top boxes, a console in rest mode, a doorbell transformer, a couple of power supplies warm to the touch — is 394 kilowatt-hours a year, which beats the kettle comfortably. But the floor is not standby alone, and treating it as though it were is how the diagnosis goes wrong. Refrigeration compressors cycle through the night; a circulator left on a permanent setting holds a steady few dozen watts; a cellar dehumidifier, a sump pump, an inverter's tare draw, a car charger idling with nothing plugged in and an outbuilding on the same supply all live in that floor, and every one is a different repair.
Where no interval data exists, the floor can be measured at the meter, and the technique is worth knowing because it also yields per-circuit numbers no supplier portal can. Nearly every electronic meter has a pulsing indicator on the faceplate with a constant printed beside it in impulses per kilowatt-hour, commonly 1,000 imp/kWh. Time the interval between pulses and the instantaneous load falls straight out: watts equals 3,600,000 divided by the product of the meter constant and the seconds between pulses. At 1,000 imp/kWh, one pulse every thirty-six seconds is exactly 100 watts and one every 3.6 seconds is a kilowatt. It is a true active-power reading from a certified instrument, which is more than can be said for most of what gets clipped around a cable.
- Pick a night nobody needs anything: no laundry, no delay-timed dishwasher, no car charging, no immersion boost scheduled.
- Time ten pulses rather than one and divide, so a single mistimed press does not become the answer.
- Take the whole-house floor first, then switch off one circuit at a time and re-time, writing each difference against the circuit label.
- Do the socket circuits last and slowest — small always-on loads only separate out by unplugging them one at a time with the circuit back on.
- Leave alarm, freezer and medical circuits energised, then restore everything and write the per-circuit watts inside the consumer unit door.
Nameplate lies, and a clamp meter lies differently
A nameplate rating is a ceiling declared under the manufacturer's stated conditions, not a description of ordinary life. Anything with a compressor, a thermostat, a variable-speed motor or an inverter drive spends most of its running time well below the number moulded into its label; anything with a heating element spends most of its time at exactly that number or at zero, with nothing in between. A census built from nameplates puts the kettle, the dryer and the oven at the top and leaves the actual answer off the page.
For anything on a plug, a socket-mounted energy monitor settles it, and the specification worth reading is its accuracy class rather than its display resolution. Domestic metering accuracy is defined by IEC 62053-21 for static active-energy meters in classes 1 and 2, by ANSI C12.20 for the tighter revenue classes, and by Annex V of the Measuring Instruments Directive 2014/32/EU for the class A, B and C designations on European equipment. The consequence sits at the bottom of the range: a monitor honest about a two-kilowatt load can be badly wrong about a three-watt one, which is unfortunate given that three-watt loads running all year are precisely what the audit hunts. Gang several small devices onto one monitored extension lead so the total lands where the instrument can resolve it.
Clamp ammeters are the instrument most likely to produce a confidently wrong number. A clamp measures RMS current in one conductor. Multiplying by nominal voltage gives apparent power in volt-amperes, and the active power the utility meter records and bills is that figure times the power factor — well below unity for a small single-phase induction motor under part load, and degraded further for switch-mode supplies by a current waveform that is not remotely sinusoidal, which a non-true-RMS clamp then gets wrong as well. This also disposes of a product that sells steadily online: a domestic tariff bills active energy in kilowatt-hours, reactive power is not on the bill at all, and no plug-in power-factor device can reduce a household electricity account.
Then duty cycle, which is the difference between a measurement and a number. A refrigerator observed for five minutes reads either ninety watts or zero depending on when you looked. Leave the monitor on it for a full twenty-four hours and read the accumulated kilowatt-hours; that is the only figure worth writing down.
| Instrument | The quantity it reports | Where it misleads |
|---|---|---|
| The appliance nameplate or rating label | Rated maximum input under the manufacturer's declared test conditions | It is a ceiling. Anything that cycles, modulates or thermostats spends most of its life far below it, and some of it at nothing |
| A plug-in socket energy monitor | Active energy in kilowatt-hours accumulated at that one socket | Its accuracy class is worst at the bottom of its range, which is where standby loads live, and it cannot see anything hard-wired |
| A clamp ammeter on a single conductor | RMS current, and nothing else | Current times voltage is volt-amperes; the billed watts are that times the power factor, which a clamp cannot see and a motor drags well below one |
| The utility meter's impulse output | Active energy to the accuracy class the meter was certified to | It is whole-house, so every reading requires the rest of the building to be held still while you take it |
| The half-hourly consumption series from the supplier | Active energy in half-hour blocks, for the whole supply | It resolves nothing shorter than the block, so a kettle, a shower and an oven inside the same half hour arrive as one indivisible number |
Rank by the year, not by the nameplate
Energy is power multiplied by time, and time is the term everybody gets wrong. A three-kilowatt kettle is the loudest appliance in the house and boils for perhaps eight minutes a day: 0.4 kilowatt-hours daily, around 146 a year. The forty-five watts of permanently energised electronics from the night floor is 394. The kettle feels enormous and is a rounding error; the shelf of quietly warm boxes feels like nothing and is nearly three times its size. An audit that ranks by wattage rather than by annual kilowatt-hours aims the household's money at the wrong thing with total confidence, every time.
For anything that cycles, convert the measurement into equivalent full-load hours before it goes on the list. A refrigerator that accumulated 0.9 kilowatt-hours over a monitored day, with a measured running draw of ninety watts, ran the equivalent of ten hours at full load — 0.9 divided by 0.09 — and those ten hours build the annual figure, not the twenty-four it spent plugged in. The same conversion applies to a heat pump, a freezer, a thermostatic circulating pump, and a washing machine whose element heats during only part of a cycle. Skip it and the answer lands between two and ten times too large, which is the sort of error that survives review because it still looks like a plausible amount of money.
Manufacturer label data fills the gaps, provided it is read for what it is. In the United States the EnergyGuide label is required by the Federal Trade Commission's Energy Labeling Rule at 16 CFR Part 305, and its annual kilowatt-hour figure comes from the Department of Energy test procedures in 10 CFR Part 430, Subpart B. In the European Union and the United Kingdom the framework is Regulation (EU) 2017/1369, with refrigerating appliances under Regulation (EU) 2019/2016 and washing machines under (EU) 2019/2014 — where the 2021 rescaling moved the declared unit from kilowatt-hours per year to kilowatt-hours per hundred cycles, so labels from either side of that date need converting before comparison. And every one of these figures comes from a standardised test with a defined load, ambient and programme: an excellent basis for comparing two machines, a poor prediction of what yours does in your kitchen.
The deliverable of the whole exercise is one sorted list: every load in the house, in kilowatt-hours per year, largest first. Not a report, not a score, not a colour-coded rating. Price each line at the unit rate off your own bill and the list re-sorts, sometimes differently, because a load running entirely at night on a time-of-use tariff is cheaper per kilowatt-hour than one running at six in the evening.
Enter the measured running wattage and the equivalent full-load hours the monitored day gave you — not the nameplate rating, and not the hours the thing spent plugged in. Its headline answer is money, so take the daily kilowatt-hour figure out of the breakdown and multiply it by 365: that annual kilowatt-hour number is the one that belongs on the sorted list, and the sum of those numbers is what the reconciliation two sections down has to set against the meter.
The device's rated power draw.
The average daily runtime.
Your local electricity rate.
Energy used per year
1,100 kWh
Figures that depend on a rate wait for yours — this page does not assume one.
- Daily energy use
- 3 kWh
They open the calculator with your figures already in it
Appliance Energy Cost Calculator: 1,095 kWh — shown in imperial, US market. The link sets both, so the result they see is the one on your screen.
What this calculation does not cover
- This is a running-cost estimate, not a load calculation. Nothing here checks whether the circuit, breaker or conductors can carry the appliance — that is a separate calculation under the code in force where you are, and a 20,000 W entry returns a cost with no comment at all on the supply feeding it.
- The model assumes the appliance draws the entered wattage steadily for every hour entered. Anything that cycles or modulates — a refrigerator, freezer, heat pump, inverter-driven washer — spends most of its running time below the nameplate figure, and you have to convert that duty cycle into equivalent full-load hours yourself before entering it. Plate watts against plugged-in hours overstates a fridge several times over.
- Standby and off-mode draw is not counted. The hours entered are running hours, so the watts a television, microwave clock or charger pulls for the rest of the day sit outside the calculation entirely, and across a whole house those form a load of their own.
- One flat rate is applied to every kilowatt-hour of the year. Standing or daily supply charges, tiered blocks, time-of-use and seasonal rates, taxes and levies, and any price change during the year are all outside the model — use your bill's effective rate (total charges divided by total kWh) if your tariff is not flat. The currency symbol is a label on your own number; nothing here converts between currencies.
- The same daily runtime is applied to all 365 days. A heater, air conditioner, pool pump or dehumidifier runs on a season rather than on an average day, so for those loads the annual figure is only as good as the year-round average hours you fed it.
The four loads big enough to double a bill on their own
Most of the census is small. Four things are not, and if any of them arrived during the period the bill covers, the investigation is over before it starts. A car is the first: electric vehicle consumption is not marginal against household demand, it is comparable to the entire rest of the house. A vehicle covering sixteen thousand kilometres a year at eighteen kilowatt-hours per hundred draws about 2,880 kilowatt-hours into the battery, and nearer 3,200 through the meter once charging losses are counted — more than a good many small flats use in total. A dedicated overnight tariff changes what that costs by a large factor and the kilowatt-hours not at all, which is why price and quantity had to be separated first.
The second is a change of heating fuel, and it is the one most often misdiagnosed as a disaster. A heat pump replacing gas or oil moves a large load onto the electricity account, and the electricity bill will rise sharply and correctly. Whether the household is worse off depends on the total across both fuels and on the seasonal coefficient of performance actually achieved, measured under the conditions in EN 14825 and EN 14511 and heavily dependent on flow temperature — a system running hotter than its emitters were sized for misses its own datasheet by a margin that shows up on the bill and nowhere else. Never audit the electricity account alone where the heating changed; add back the fuel that stopped being bought.
The remaining two are water heating and standing leisure loads. An immersion heater at three kilowatts for two hours a day is six kilowatt-hours daily and 2,190 a year — larger than most households would guess, and often reduced by fixing a timer or a failed thermostat rather than by buying anything. An 8.5-kilowatt electric shower run for ten minutes is 1.42 kilowatt-hours per use, so two a day is about 1,035 a year. A hot tub, a pool pump on a long schedule or a heated workshop sit in the same bracket, and each hides in the night floor rather than in anybody's mental model of the house.
Worth running even on a car that was already there. This one answers in money rather than kilowatt-hours — usable battery capacity and the range it covers give cost per full charge and cost per mile — so it is the single census line that gets priced before it gets counted. The cost-per-mile output is the figure to set against the fuel it replaced, which is the only comparison that answers whether the household's total energy spend actually went up.
Your EV's usable battery capacity.
Your home electricity rate.
Your vehicle's rated range on a full charge.
Energy per full charge
75 kWh
Figures that depend on a rate wait for yours — this page does not assume one.
They open the calculator with your figures already in it
EV Home Charging Cost Calculator: 75 kWh — shown in imperial, US market. The link sets both, so the result they see is the one on your screen.
What this calculation does not cover
- It prices the energy stored in the battery, not the energy the meter records. Onboard-charger and cable losses, battery thermal conditioning and cabin preconditioning all draw billed kWh this calculation ignores, so the real bill runs above the figure shown — more so in cold weather and on slow Level 1 charging.
- One flat rate per kWh is all it takes. Time-of-use bands, tiered block rates, standing or daily supply charges, demand charges, taxes and levies not already inside the rate you type, and any solar self-consumption or export credit are all outside the model.
- Range is whatever you type, held fixed. Cold weather, cabin heating, speed, terrain, load, tyres and pack degradation over the vehicle's life all move miles per charge, and there is no seasonal or degradation term here — the cost per mile is only as good as the range figure you enter.
- It assumes a single charge from empty to full. It does not model partial top-ups, a routine charge limit set below 100%, or a mix that includes public or DC fast charging with its own per-kWh premium, session fees and subscription plans.
- This is a cost estimate, not an electrical design. It says nothing about whether the circuit, cable, protective device or supply capacity can serve a charge point, and nothing about the added load on the existing service — sizing and protecting an EV charge point circuit is a separate calculation under the wiring rules in force, and the installation itself is regulated work in most jurisdictions.
Reconciling the census against the meter, because the gap is the finding
Add the sorted list up and compare the total against the annual kilowatt-hours the meter recorded. The two will not match, and the difference is not an embarrassment to be smoothed over — it is the most informative number the audit produces, because it measures directly how much of the house has not yet been found. A census accounting for sixty per cent of the meter has not identified the biggest load; it has identified the biggest load among the ones that were easy to measure, which is a different and much weaker statement.
This is not a nicety invented here. Reconciling a disaggregated model against measured consumption is what separates an energy audit from a walk round with a clipboard, and it is written into the standards that govern the work: BS EN 16247-1 with its buildings-specific Part 2, ISO 50002, and the residential ANSI/BPI-1100-T home energy auditing standard all require the analysis to be tied back to metered data rather than left as an unchecked sum of assumptions. CIBSE TM22 sets out the same discipline, breaking consumption into an accounted tree and treating whatever will not fit as an explicit residual, and ASHRAE Standard 211 formalises it into audit levels on the commercial side.
When the residual is large the causes repeat. Hard-wired loads get missed because a plug-in monitor cannot reach them — towel rails, humidistat extract fans, underfloor mats, trace heating on a pipe run, an outside light on a failed photocell, a garage or annexe on the same supply. Heating gets underestimated because equivalent full-load hours were guessed. Occasional heavy use gets left out entirely: a workshop compressor, a kiln, a welder, a dehumidifier run for a fortnight after a leak. And sometimes the residual is a fault, in which case it is flat, present at three in the morning, and already visible in the night floor — which is why that measurement comes before the census rather than after it.
- Subtract the sorted list's total from the meter's twelve-month total, and record the residual as a figure and as a percentage.
- Split it by season using the energy signature: a residual that grows with cold weather is unmeasured heating, a flat one is a permanent load.
- Walk the consumer unit and list every circuit with no census line against it — that is where hard-wired loads hide.
- Re-measure whatever was estimated rather than monitored, starting with the estimate large enough to close the gap on its own.
- Stop when the residual is smaller than the item you are about to buy, and write down what it was rather than quietly dropping it.
Two league tables, because cost and carbon do not rank the same
Run the same census through a grid emission factor and it re-sorts. Emissions are consumption multiplied by the factor for the grid and the reporting year, and that factor is the term with the enormous range: published national figures span more than an order of magnitude between a hydro or nuclear grid and a coal-dominated one, and in most markets they fall measurably every year. An assessment that does not name its factor and its year has not said anything checkable. Take the number from a named published set — the UK Government GHG Conversion Factors for Company Reporting, the US EPA's eGRID for the relevant subregion, or the IEA's emission factors — not from a figure remembered off a job in another country.
Two accounting choices sit behind that number and both need stating. The GHG Protocol Scope 2 Guidance defines location-based accounting, which uses the physical grid average where the meter sits, and market-based accounting, which uses the supply actually contracted, including a renewable tariff. The same consumption produces very different totals under the two, and both are legitimate for their own purposes; what is not legitimate is quoting one and calling it the other, which is how a household on a green tariff comes to believe its remaining consumption has no consequence when neither the electrons nor the local grid have changed. Separately, an avoided kilowatt-hour is displaced at the margin rather than at the average — which is what the EPA's AVERT tool estimates, and why an avoided-emissions figure and an inventory figure are different calculations.
The point of keeping both league tables is that the top of one is often not the top of the other. In a house that heats with gas, the largest carbon number on the property is not on the electricity bill at all, and an audit stopping at the meter has surveyed the smaller half of the problem. On a grid whose intensity swings by a factor of three across a day, moving a dishwasher or a car charge into the small hours cuts emissions without cutting a single kilowatt-hour — and on a time-of-use tariff it cuts cost too, though not necessarily in the same hours, since the cheapest half-hour and the cleanest half-hour are set by different mechanisms.
Feed it the twelve-month meter total rather than the census sum, so the residual is carried rather than silently written off, and give it the factor and the year you lifted off your own national set. Its breakdown already carries the projection at the decarbonisation you assumed and at a static grid, side by side: the difference between those two lines is a forecast about national policy, and it should never be allowed to hide inside a household decision.
Metered consumption over a year.
Your grid's published factor for the reporting year.
Period over which to accumulate.
Assumed yearly fall in the grid factor.
Annual emissions
9,320 kgCO₂e/year
Arithmetic on the factor you supply. The result is only as good as that factor and the decarbonisation assumption, and the latter is a forecast rather than data.
- Year one, in tonnes
- 9.32 tCO₂e
- Cumulative over 25 years
- 165.5 tCO₂e
- Cumulative at a static grid
- 232.88 tCO₂e
- Difference the decarbonisation assumption makes
- 67.37 tCO₂e
- Final-year factor
- 0.1 kgCO₂e/kWh
They open the calculator with your figures already in it
Operational Carbon from Electricity Calculator: 9,315 kgCO₂e/year — shown in imperial, US market. The link sets both, so the result they see is the one on your screen.
Add the equipment this sizes
This result is a specification — 9,320 kgCO₂e/year — not a quantity. Put the thing it sizes into your project: how many, what you call it, and your supplier’s price.
What this calculation does not cover
- Electricity only. Gas, oil, district heat and refrigerant leakage are separate and often larger contributions in an existing building.
- Location-based and market-based accounting give different answers for the same consumption; a report must state which it uses.
- The decarbonisation projection is an assumption about policy and investment over decades. Where the result is used to justify a decision, show it at zero as well — the breakdown gives you both.
Aiming the next spend, and proving afterwards that it landed
With a sorted list and a reconciled residual the sequence picks itself, in order of increasing cost. Eliminate first: the failed thermostat, the mat under the rug, the timer nobody reset after the clocks changed, the second freezer in the garage holding four things. Reduce second — schedules, controls, setbacks, and the always-on devices that turn out to have a genuine off state. Substitute third, where resistance heating gives way to a heat pump and the coefficient of performance does the work. Generate last, because self-consumed generation is worth only what the consumption it displaces was worth, and generating into a load you had not yet reduced is paying twice for the same kilowatt-hour.
Comparing measures needs one caution. Simple payback is the natural ranking and it quietly favours short-lived measures: a control change paying back in a year and lasting five is not obviously better than a fabric measure paying back in nine and lasting forty, and the payback figures alone say it is. Rank by payback within a category and by lifetime saving across categories. Where a grant, rebate or tax credit exists, read its terms before buying — many schemes require the application, the assessment or an approved installer to be in place before work starts and cannot be applied to an invoice after the fact.
Then prove it on the instrument that found the problem. Re-plot the energy signature and compare slopes and intercepts rather than bills: a fabric or heating measure should rotate the sloped arm, a base-load measure should drop the flat band and leave the slope alone, and a measure that moved neither did not work whatever the next bill says. That weather normalisation is the whole point of the IPMVP's routine adjustments under its whole-facility Option C and of the baseline criteria in ASHRAE Guideline 14 — savings claimed by subtracting one winter's bill from another's are a statement about the weather, and a mild January will happily award full marks to work that achieved nothing.
- Fix everything on the eliminate list first, then re-read the night floor to confirm each one actually came off.
- Rank what remains by annual kilowatt-hours saved, price it, then re-rank by lifetime saving rather than by payback alone.
- Check grant and rebate eligibility, and the order of operations each scheme demands, before placing any order.
- Keep to one measure per period where the data allows, so the signature can attribute the change to something specific.
- Leave the record behind: the night floor with its date, the per-circuit watts, the base temperature the regression settled on, and the grid factor and year used for the carbon column.
What has to be measured before any of this is worth calculating
None of these can be assumed and none come off a datasheet. The link opens the appliance cost calculator seeded with the always-on load from the night floor — forty-five watts, twenty-four hours a day — with the carbon, unit-rate, vehicle, current-conversion and solar-payback calculators stacked beneath it. The amps-to-watts converter in that stack assumes a power factor of one, so it belongs on a nameplate current for a resistive load and never on a clamp reading, for the reason set out four sections up. Add your own unit rate and your own grid factor; neither is publishable here.
- Twelve months of daily or half-hourly kilowatt-hours — Energy, never money, and daily resolution if the meter offers it. Monthly totals give an indication; they do not give a baseline anything can be measured against.
- Daily mean outdoor temperature for the same twelve months — From the nearest published station. It is the second axis of the energy signature, and without it weather and behaviour cannot be separated at all.
- The overnight minimum from a normal week — Doubled to kilowatts and multiplied by 8,760 hours. In a house that does not heat, drive or make hot water on electricity it is frequently the largest single line, and it is always the one nobody has ever looked at.
- The meter constant in impulses per kilowatt-hour — Printed on the faceplate. Watts equals 3,600,000 divided by the constant times the seconds between pulses, which is how per-circuit readings get taken without a clamp.
- Monitored kilowatt-hours over a full day for every cycling appliance — Divided by the measured running wattage to give equivalent full-load hours. Entering clock hours instead overstates a fridge several-fold.
- The grid emission factor, with the year and the accounting basis it came from — Location-based or market-based under the GHG Protocol Scope 2 Guidance. The two give different answers for identical consumption, and a report has to say which it used.
Opens the calculators above on one screen with the dimensions from this article already filled in. Quantities only — this site publishes no price list, because local prices vary too much to publish honestly.