
One Ditch, Two Sums, and Only One of Them Is Yours
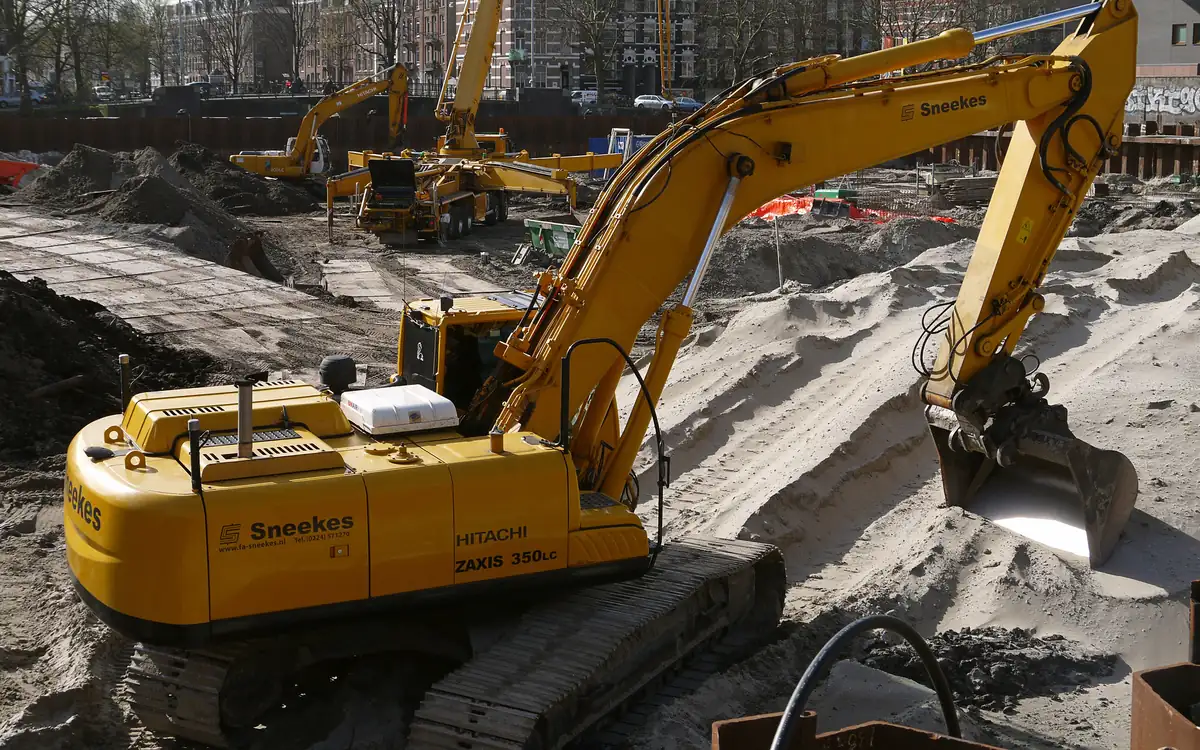
A plant hire depot laid 2,400 m² (about 26,000 sq ft) of new concrete hardstanding across what had been a grazed paddock and took the runoff into a grass ditch along the boundary fence — roughly 600 mm (2 ft) across the bottom, banks left at whatever angle the bucket walked out, running on the 3% fall the paddock already had, out to a connection into the highway authority's ditch that had been permitted before any of it was dug. It held through a wet autumn without a mark on it. The following July a short, violent cell sat over the yard for twenty minutes, and by the time anyone walked the fence line the flat bottom had a gully 300 mm (12 in) deep cut straight down the middle of it and a fan of the depot's own fines was spread across the authority's ditch, which is the sort of thing that gets a permitted connection reopened as a subject.
Nothing was wrong with the capacity. That section on that grade would have carried several times the flow the storm produced without the water coming close to the top of either bank, and if the only question asked had been whether the flow fits, the ditch passed comfortably. What it had never been given was the second sum. Water moving fast enough to cut through an established sward does not have to be deep, and a section that is generous in area and steep in grade is exactly the arrangement that produces speed rather than depth. Capacity and velocity fail in opposite directions, so a channel checked only for capacity has been checked for one of the two ways it can go wrong and cleared on that basis.
The shape of the work follows from a division that is worth stating plainly, because it decides which numbers are worth arguing about. Peak flow is not a design decision. It is handed to you by the area that drains to the point being sized, the surfaces inside that area, and the storm the jurisdiction has told you to design against — you can measure it more carefully or less carefully, but you cannot make it smaller by drawing something different. Everything downstream of that number is design: bottom width, side slopes, longitudinal grade, lining. So the job is a loop rather than a calculation. Fix the flow, take a trial section, test it for capacity and again for velocity, move whichever geometric variable is actually free on this site, and go round again until both checks pass at once.
Reading the Storm on the Catchment's Own Clock
The Rational Method asks for three things and gives you one, and the three are nothing like equally hard to get. Area is survey work. The runoff coefficient is a lookup, tedious on a mixed catchment but not difficult. Intensity is the awkward one, because a design storm's intensity depends on how long it is assumed to last, and the duration you are meant to use is the travel time from the hydraulically most remote corner of the catchment to the point being sized — which depends in part on the channel you have not designed yet. The circularity is real, and it is resolved the way circularities usually are on site: assume, compute, come back round once the section exists.
Time of concentration is built segment by segment rather than guessed as a whole. NRCS Technical Release 55, Urban Hydrology for Small Watersheds, sets out the usual breakdown: an initial length of sheet flow across the surface, then shallow concentrated flow once it has gathered into rills and gutters, then channel flow along the swale itself, each with its own travel-time expression. The sheet-flow segment carries a maximum length in that document and several state manuals cut it further, so take the limit from the manual your submission is reviewed against. At the other end, most manuals impose a floor on the total — commonly a few minutes — beneath which the curve is simply not read, because it is not published there and the arithmetic runs away if you extrapolate.
The intensity itself comes off a published curve for the actual location, at the return period the reviewing authority nominates, and the curve is a named dataset rather than a regional impression. In the United States that is NOAA Atlas 14, Precipitation-Frequency Atlas of the United States, or the successor product the jurisdiction has adopted; in the United Kingdom it is the depth-duration-frequency data from the Flood Estimation Handbook; in Australia it is the intensity-frequency-duration data published with Australian Rainfall and Runoff. The return period is not yours to pick either. A roadside ditch is typically conveyed for one frequency and checked for a rarer one, and which pair applies is written into the adopted stormwater ordinance or the state road authority's drainage manual — those two documents disagree often enough that the wrong one produces a submission that is arithmetically perfect and rejected anyway.
Two details catch people who have used the method for years. The first is that the coefficient has to be weighted across surfaces and that the land beyond the boundary belongs in the sum with its own value: a paved yard and a grassed field lumped under one figure either overstates the field or understates the yard, and a reviewer given a single blended number with no working behind it will ask for the split. The second is that the familiar constants are unit artefacts and nothing more — the 1.008 that appears with intensity in inches per hour and area in acres, and the divisor of 360 that appears with millimetres per hour and hectares, are conversions carrying the answer into the flow unit each system quotes rather than anything physical. There is also a ceiling on the method itself: FHWA's HEC-22, Urban Drainage Design Manual, treats it as a small-catchment tool, and local ordinances routinely set a limit well below that, past which a hydrograph method is required instead.
| The number | Where it comes from |
|---|---|
| Contributing area | Contours as graded, traced to the point being sized. Cutting a pad moves a divide, and the survey stops at the fence while the catchment does not. |
| Runoff coefficient | The table in the manual the submission is reviewed against, weighted across surfaces. Published values for the same surface differ between jurisdictions. |
| Design return period | The adopted stormwater ordinance, or the road authority's drainage manual where the ditch is in a highway reserve. Conveyance and check storms are usually different frequencies. |
| Rainfall intensity | The published frequency curve for the site: NOAA Atlas 14 in the United States, Flood Estimation Handbook depth-duration-frequency data in the UK, Australian Rainfall and Runoff intensity-frequency-duration data in Australia. |
| Storm duration | The catchment's time of concentration, not a round number. Reading a shorter duration overstates intensity; reading a longer one understates the peak. |
| Travel-time method and its segment limits | NRCS TR-55, Urban Hydrology for Small Watersheds, or whatever the local manual names in its place. The maximum sheet-flow length belongs to that document. |
| Whether the method applies at all | FHWA HEC-22 sets the broad ceiling; the local ordinance usually sets a stricter one, and the stricter figure governs. |
Keep the yard and the land beyond the fence apart, each with its own coefficient, and read the intensity off your own curve at the duration the catchment actually takes — the page reports how much of the peak is arriving from ground you do not control.
Area inside the site boundary that drains to the point being sized.
Fraction of rainfall on the site area that becomes surface runoff.
Area beyond the boundary whose water crosses onto the site and has to be carried through it.
Runoff fraction for the surface beyond the boundary, which is rarely the same as the site's.
Average intensity of the design storm over the catchment's time of concentration (25.4 mm/hr is 1 in/hr).
Peak discharge
1.49 ft³/s
The Rational Method returns a peak flow and nothing else — no hydrograph, no volume, no timing. It is accepted for small catchments and routinely rejected above a size limit written into the local ordinance, so check that limit before using this figure in a submission.
- Total contributing area
- 34,450 ft²
- Area-weighted runoff coefficient
- 0.63 (C)
- Contribution from beyond the boundary
- 0.31 ft³/s
- Share of the peak arriving from offsite
- 20.79 %
They open the calculator with your figures already in it
Rational Method Peak Runoff Calculator: 1.49 ft³/s — shown in imperial, US market. The link sets both, so the result they see is the one on your screen.
Add the equipment this sizes
This result is a specification — 1.49 ft³/s — not a quantity. Put the thing it sizes into your project: how many, what you call it, and your supplier’s price.
What this calculation does not cover
- Assumes uniform rainfall over the whole catchment for the full duration, and a single time of concentration for both areas.
- Gives no runoff volume, so it cannot size detention or infiltration storage — those need a hydrograph method.
A Trial Section Is a Guess You Are Allowed to Check
Open-channel capacity comes from Manning's equation, which relates the mean velocity to the roughness of the lining, the hydraulic radius and the square root of the longitudinal slope, and then gets multiplied by the flow area to give a discharge. Worked in SI the leading term is one over n; worked in US customary units it is 1.486 over n, which is the same equation wearing the unit conversion on its sleeve rather than hiding it. For a trapezoidal ditch of bottom width b, side slopes Z horizontal to one vertical and flow depth d, the flow area is (b + Zd)d and the wetted perimeter is b plus twice d times the square root of one plus Z squared, and the hydraulic radius is the first divided by the second. Ven Te Chow's Open-Channel Hydraulics remains the standard reference for the derivation and for the assumptions it rests on.
Those assumptions matter more than the algebra. Manning's equation describes uniform flow — constant depth along the reach, with the water surface parallel to the bed — and there are several places in a real ditch where that is simply untrue. It is untrue at the head where flow enters, untrue approaching a culvert headwall, untrue through a bend, untrue immediately above and below a check dam, and untrue anywhere the outlet is drowned. What the equation gives you is the normal depth for a long, straight, prismatic reach, which is the right tool for sizing the reach and the wrong tool for predicting what happens in the last few metres at either end.
When the first trial section fails, the useful question is which variable is actually free. Longitudinal grade is usually the least free of the four, set by the ground between the pad and the permitted outlet and by the invert of every crossing along the way; flattening it means either cut that has to go somewhere or an outlet you no longer reach. Side slopes are constrained from outside the hydraulics entirely — by what a tractor can mow, and next to a road by what a vehicle leaving the carriageway can traverse. Depth costs bank height and freeboard, and raises velocity rather than lowering it. That leaves bottom width as the variable usually both available and helpful: widening the base spreads the same flow into a shallower sheet, cutting the hydraulic radius and with it the velocity, at the price of easement width and more ground to establish and mow.
What a grassed ditch is actually built from
- Grass cover — the working lining, and the only part of the section whose roughness is quoted in the capacity sum; bought as seed against the wetted area of both banks and the bottom Grass Seed Calculator
- Rolled blanket or turf reinforcement mat — carries the channel through the establishment period, or permanently where velocity is over what bare turf holds; the ditch rating is the channel test, not the slope test the same product also carries Erosion Control Blanket Roll and Staple Calculator
- Topsoil growing layer — respread over the shaped section so the cover roots into something; placed loose and never track-packed, since compacted topsoil sheds almost like pavement Topsoil Calculator
- Shaped and compacted channel section — bottom width, side slopes, flow depth and longitudinal grade — the four numbers the capacity and velocity checks are both run against, and the only ones you get to choose Grassed Swale Capacity & Velocity Calculator
- Ground below, and the cut it yields — widening the base to slow the flow is bought in excavated volume that then has to be placed, hauled or balanced against fill elsewhere on the site Slope Cut-and-Fill Earthwork Balance Calculator
Put the trial geometry in and read the velocity alongside the capacity, because the two answers move in opposite directions and a section that passes on discharge is only half checked.
Flat width across the base of the swale, before the side slopes begin.
Horizontal run of each bank for every unit of rise — larger numbers are flatter banks.
Depth of water in the section at the design flow, measured from the invert.
Fall along the length of the swale, as a percentage.
Roughness of the lining at the retardance class being assumed.
Fastest flow this lining and soil combination is allowed to see, from the governing guidance.
Swale flow capacity
43.4 ft³/s
Velocity sits inside the permissible figure entered, so the reach can stay grassed on this check. Repeat it at the lowest roughness the sward will ever have — freshly cut turf is faster than the design value most people enter.
- Mean flow velocity
- 3.81 ft/s
- Flow cross-sectional area
- 11.39 ft²
- Wetted perimeter
- 10.95 ft
- Hydraulic radius
- 1.04 ft
- Permissible velocity for the lining
- 4.92 ft/s
- Velocity as a share of the permissible
- 77.47 %
They open the calculator with your figures already in it
Grassed Swale Capacity & Velocity Calculator: 43.42 ft³/s — shown in imperial, US market. The link sets both, so the result they see is the one on your screen.
Add the equipment this sizes
This result is a specification — 43.4 ft³/s — not a quantity. Put the thing it sizes into your project: how many, what you call it, and your supplier’s price.
The shaded area is the flow area Manning's equation was solved over, and its outline below the water line is the wetted perimeter. Both come from the bottom width, the side slope and the depth of flow you entered — the section is the figure those formulae are written about.
What this calculation does not cover
- Uniform steady flow: Manning's equation assumes the depth is constant along the reach, which is untrue near an inlet, an outfall, a bend or a check dam.
- Takes one roughness value. Real grass channels vary along their length and through the season, and the capacity and velocity answers deserve different values of n.
One Channel, Two Values of n
Roughness for a grass lining is not a property of the ditch; it is a property of the sward on the day, and the sward changes. Turf mown a week ago behaves nothing like the same channel in late summer with a long, dense, partly laid cover in it, and the gap between them is a factor of several on n rather than a rounding. One value therefore cannot be conservative for both checks, because the two want opposite errors. Capacity is worst when the channel is roughest, since that is when the flow runs deepest and nearest the top of the bank; velocity is worst when it is smoothest, since that is when the same flow runs fastest across the soil. Run capacity at the high end of the range the cover will occupy and velocity at the low end, and accept two runs rather than one.
There are two established ways to finish the erosion side of that, and they are not interchangeable. The older one, which a great many local manuals still use and which the calculator on this page follows, compares the computed mean velocity against a permissible velocity for the lining and soil combination. Those permissible figures, and the roughness values that go with them, descend from USDA Natural Resources Conservation Service work on grassed waterways — Conservation Practice Standard 412, Grassed Waterway, and the Grassed Waterways chapter of the National Engineering Handbook Part 650, Engineering Field Handbook, are the documents that carry the practice. In that tradition n is not a single tabulated number at all: it is read from a retardance curve against the product of velocity and hydraulic radius, which makes the roughness implicit in the answer and the solution iterative even before you have thought about the season.
The newer approach, which most highway work now runs on, replaces permissible velocity with permissible shear stress. FHWA's HEC-15, Design of Roadside Channels with Flexible Linings, works from the shear the flow applies to the boundary — a function of depth and slope — and compares it against a shear the lining and soil can take, with the grass roughness treated as varying with flow depth rather than fixed. The physical argument for it is straightforward: it is force on the soil particle that moves the particle, and two channels can share a mean velocity while applying very different shear to their beds. If the manual your submission is reviewed against names HEC-15, do it that way and do not present a velocity check instead; if it names a permissible-velocity table, use the table. What you must not do is take the permissible figure from one framework and the demand from the other.
Whichever framework applies, the case that governs is usually the first large storm after construction, and it is the one least often checked. A ditch shaped and seeded in October has no cover in November, and the permissible figure for a newly seeded sward on disturbed soil is a fraction of the one for a dense established cover on the same ground. That is the whole justification for a rolled blanket in a channel that will eventually be perfectly happy as plain turf: temporary reinforcement bought to cover a gap in time, not a permanent upgrade to the lining. Where the design velocity sits close to the permissible even at maturity, the temporary product becomes a permanent one and the conversation moves to turf reinforcement mats or a hard lining for that length.
The Reach That Comes Back Over
Four responses are available to a length that fails the erosion check, and they are worth ranking by what they cost on your particular site rather than by preference. Widening the bottom is usually first: it spreads the flow, drops the depth and the hydraulic radius together, and lowers velocity without touching the grade or the outlet, at the price of easement width and mowing area. Flattening the longitudinal grade is next in theory and often unavailable in practice, since the fall to the permitted outlet is fixed and every crossing invert pins a point on the line. Breaking the fall into steps with check dams keeps the reach grade but reduces the effective slope between structures, which is frequently the least disruptive fix on a ditch already dug — the conventional spacing rule in erosion and sediment control manuals is that the toe of each dam sits level with the crest of the one below it, which sets the interval from the dam height and the grade. Changing the lining for the length that is over is the fallback, and the honest one where nothing else is free.
If it comes to a product, the qualification matters more than the marketing. Rolled erosion control products are tested two different ways: ASTM D6459, Standard Test Method for Determination of Rolled Erosion Control Product Performance in Protecting Hillslopes from Rainfall-Induced Erosion, is the slope test, and ASTM D6460, the equivalent method for protecting earthen channels from stormwater-induced erosion, is the channel test. A ditch is governed by the second. A product carrying an impressive slope rating and no channel data has not been tested for what you are about to ask of it, and the manufacturer's literature will say which test the published figures come from if you look for the standard number rather than the headline. Quantity is then geometry: a ditch is two bank faces plus a bottom, each bank longer than its plan projection by the slope factor, with the staple pattern read off the product's own chart.
- Identify the reach that fails by station, not by eye — a ditch that passes overall will usually have one steep length doing all the damage.
- Try the geometry first: widen the base and re-run both checks before accepting that the reach needs a product.
- Where check dams are the answer, set their spacing from the dam height and the reach grade, with each toe level with the crest of the next one downstream.
- Select the lining against its channel test data under ASTM D6460, not against the slope rating on the same datasheet.
- Take the quantity off both bank faces and the bottom separately, allowing for the slope factor on each bank, and add the longitudinal and end overlaps the installation instructions require.
- Anchor the upstream end in a trench so the flow cannot get beneath the leading edge, and staple to the product's own pattern chart rather than to habit.
Run it once for each bank face, using the plan projection of that bank and its slope ratio, then add the flat bottom separately — a ditch take-off done as a single slope under-orders every time.
The distance up the slope as it appears on plan, measured horizontally.
Enter 3 for a 3:1 batter — three across for every one up.
The distance along the slope, measured across the direction the rolls run.
The width of the product as supplied, from its data sheet.
The length on the roll as supplied, from the same data sheet.
How far each strip laps over the one beside it.
The shingle lap where an upslope roll runs over the roll below it.
The extra material each strip needs to turn down into the crest trench and be backfilled.
The staple density the manufacturer's slope chart calls for at your slope and product.
Blanket rolls needed
17 rolls
Roll and strip counts round up whole units, so a face whose width is a fraction over a strip boundary buys a full extra roll. Seeding, tackifier and the trench excavation are separate items.
- Slope face length
- 62.19 ft
- Slope face area
- 8,084.89 ft²
- Plan area of the same slope
- 7,670 ft²
- Strips across the face
- 17 strips
- Rolls per strip
- 1 roll
- Staples required
- 1,797 staples
- Material purchased
- 14,960 ft²
They open the calculator with your figures already in it
Erosion Control Blanket Roll and Staple Calculator: 17 rolls — shown in imperial, US market. The link sets both, so the result they see is the one on your screen.
Estimated cost — your price
This site holds no price list for this material — local prices vary too much to publish honestly. Enter your supplier's price and the result is costed with it.
What this calculation does not cover
- Hillslope geometry only. Blanket in a channel is governed by shear stress under ASTM D6460 and is not sized here.
- The staple pattern is taken from your product chart; this page counts staples, it does not select the pattern.
- No allowance for cutting around structures, inlets or benches — deduct or add those separately.
Beside a Road, Hydraulics Is Not the Only Client
A ditch inside a highway reserve answers to a second document with its own opinions about the section, and that document usually wins. The AASHTO Roadside Design Guide treats the ground beyond the edge of the travelled way as a recovery area and sets out which combinations of front slope and back slope let a vehicle that has left the carriageway cross the channel and slow down rather than trip, dig in or roll. A narrow, deep, steep-sided section is often the hydraulically neat answer and one of the least acceptable answers on that measure — the shapes that perform well for traversability are broad and rounded, which pushes you toward width for a second independent reason. Where the section cannot be made traversable the alternatives are shielding or relocation, both expensive enough that redesigning is generally cheaper. The AASHTO Drainage Manual covers the hydraulic side of the same work, and outside North America the equivalent is the road authority's own manual — Austroads Guide to Road Design Part 5, Drainage, in Australia and New Zealand.
Maintenance access is the constraint that quietly decides whether a grassed ditch is still a grassed ditch in five years. The roughness the capacity check was run at assumes a sward somebody is cutting; a channel too steep-sided to mow safely stops being mown, fills with scrub and self-seeded willow, and its real roughness drifts far above anything on the drawing while its capacity drops with it. Banks a tractor can work along, an access point at each end, and a grade that does not leave standing water between cuts are all part of the design rather than an operations afterthought. Standing water is its own failure: below a certain fall a grassed channel stays saturated, loses the sward that was providing both the roughness and the erosion resistance, and becomes a reed bed with a different Manning's n from the one that was submitted.
The last external constraint is that the ditch grade is not a free line between two endpoints. Every driveway culvert, field entrance and crossing along the length fixes an invert, and those inverts were often set by somebody else years ago. The design grade is the line through the pins you have inherited, and where one sits too high the reach above it does not drain at the grade you assumed whatever the profile drawing says. Shoot the existing inverts before drawing that profile: a single legacy culvert 150 mm (6 in) proud can flatten a reach into the range where the sward will not survive the winter.
Freeboard, Bends and the Storm Bigger Than the One You Designed For
The depth that goes into the capacity check is water, not excavation. Bank height has to exceed it by whatever freeboard the governing manual requires, and that figure is a requirement to be read rather than a margin to be judged — a section built exactly to the design flow depth has none at all, which makes the design storm itself the overtopping storm. Two things then eat what freeboard there is without anyone deciding they should: newly cut banks settle and slump through their first wet season, and sediment deposits in the flat bottom of a treatment-shaped swale, which is precisely what that wide flat bottom was drawn to encourage.
Bends and tailwater both break the uniform-flow assumption the capacity check rests on, in opposite directions. Around a curve the water surface superelevates, standing higher against the outside bank than the computed normal depth, and the outside of the bend needs both the extra height and, frequently, a lining upgrade the straight reaches did not — HEC-22 and the road authority's drainage manual carry the treatment. At the downstream end, a receiving ditch, culvert or watercourse that is itself running full in the design storm raises the water level in your reach above normal depth and pushes a backwater curve upstream, so a system sized as though it always discharges into open air will surcharge from the lowest point on the site instead. Where the receiving channel has a known high-water level, use it; where it does not, the assumption of free discharge is an assumption and should be recorded as one.
Finally, decide deliberately where the water goes when it exceeds the section, because it will exceed the section eventually. Every ditch has an overtopping path whether or not anyone chose it, and the difference between a designed one and a discovered one is usually the difference between water crossing a yard and water entering a building. Identify the low point on each bank, confirm that the flow leaving there runs somewhere tolerable, and where it does not, either raise that length of bank or provide a defined spillway at a point of your choosing. This is a five-minute exercise on a profile and it is the single most valuable thing on the drawing the first time a storm arrives that is larger than the one the ordinance nominated.
What Ends Up in the File
A drainage submission is judged on whether a reviewer can reproduce your numbers, not on whether they are right, and those are different tests. The catchment plan wants the divide drawn on it and the offsite area shown separately with its own coefficient. The time of concentration wants its segments listed — length, slope, surface and method for each — rather than a single figure. The intensity wants its source named and dated, because the published curves are revised and a submission against a superseded dataset gets returned. The section wants both values of n written down with which check each was used for, since a reviewer who sees one value knows immediately that only one of the two checks was really run. And the erosion check has to say whether it is a velocity comparison or a shear comparison, and against whose permissible figures.
Once it is built, the file that matters is the as-built: flow line levels at every station and grade break, the bottom width where the machine left it rather than where the drawing put it, the crossing inverts as found, and the dates the cover was seeded and accepted as established. A ditch that silts, scours or ponds three years later becomes an argument about whether it was built as designed, and that argument is settled in ten minutes by a level book and a handful of photographs taken before the first storm — or not settled at all, which in practice means settled against whoever dug it.
Before the machine is booked
The workspace opens on the peak-flow sum for a 2,400 m² yard with 1,800 m² of grazed ground still draining across the boundary. Replace both areas and the intensity with your own, then take the answer into the section check beneath it.
- Contributing area, traced on the graded contours — Split it into the surface inside the boundary and whatever still crosses onto the site, each with its own coefficient rather than one blended figure.
- Design storm, from the document that reviews you — Return period from the ordinance or the road authority's manual; intensity from the published curve for the site, read at the catchment's time of concentration.
- Time of concentration, built from its segments — Sheet, shallow concentrated and channel lengths listed separately, with the sheet-flow limit taken from the manual rather than from memory.
- Trial section: bottom width, side slopes, depth, grade — Grade is usually fixed by the outlet and the crossing inverts; bottom width is normally the variable that is both free and useful.
- Two roughness values, not one — High n for the capacity run, low n for the velocity run. A single value has only ever answered half the question.
- Permissible figure, and which framework it belongs to — Permissible velocity from an NRCS-derived table, or permissible shear under HEC-15 — never the demand from one and the limit from the other.
- Freeboard, bend allowance and the tailwater assumption — Freeboard is a stated requirement, superelevation is extra height on the outside of every curve, and free discharge is an assumption to be recorded if it cannot be verified.
Opens the calculators above on one screen with the dimensions from this article already filled in. Quantities only — this site publishes no price list, because local prices vary too much to publish honestly.