
SettingsSettings for this calculationUS
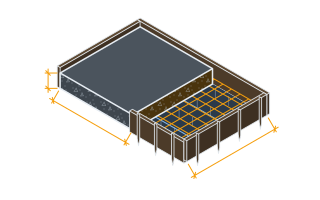
Placed volume of the element.
Design volume, not delivered. Over-ordering and waste carry their own carbon, but they belong in a separate line rather than inflating the element's declared figure.
Replacement level is the biggest lever available.
Ground granulated blast-furnace slag and fly ash substitute for clinker, which is where nearly all of concrete's carbon sits. High replacement levels slow early strength gain, which matters for striking times and for winter pours — it is a programme decision as much as a carbon one.
Used only when the mix above is set to Custom.
Take the A1-A3 GWP figure from your supplier's EPD for the specific mix and plant. This field wants the figure PER CUBIC METRE even when the volume above is showing yd³. A US EPD or mix submittal normally declares it per yd³, and 1 m³ is 1.30795 yd³, so the per-yd³ number is 23.5% smaller for the same concrete — the 215 kgCO₂e/m³ in this field's example is 164.4 kgCO₂e/yd³. Multiply a per-yd³ figure by 1.30795 before entering it. If your source quotes lbCO₂e/yd³ then the top of the unit converts as well as the bottom and the multiplier is 0.59328, not 1.30795: 362 lbCO₂e/yd³ is that same 215 kgCO₂e/m³. Neither mistake is refused — 164.4 and 362 both sit inside this field's 0-2000 range, so the wrong figure is accepted in silence and graded as though it were right. On this page's own defaults (50 m³, with the two reinforcement fields left as they are) entering 164.4 in place of 215 puts the total about 17% low and reports a saving against 100% Portland cement of 6,781 kgCO₂e where the truth is 4,250 — a claimed reduction about 60% larger than the real one.
Steel content by volume of concrete.
Around 80-120 kg/m³ for a typical suspended slab, 150-250 for a heavily loaded transfer structure, 40-60 for a ground slab. Reinforcement is frequently a fifth or more of a reinforced element's total carbon and is left out of concrete-only figures.
Depends heavily on how the steel was made.
Recycled electric-arc-furnace rebar sits far below primary blast-furnace steel — the difference is several-fold, and it is the single largest choice in the reinforcement line. Use the mill's EPD where you have it.
Embodied carbon (A1-A3)
19,000 kgCO₂e
Emission factors here are typical published ranges for orientation, not product data. A reportable assessment uses the supplier's own Environmental Product Declaration — the spread between two suppliers of the same nominal product routinely exceeds 30%.
- Tonnes CO₂e
- 18.83 tCO₂e
- Concrete
- 15,023.5 kgCO₂e
- Reinforcement
- 3,805.95 kgCO₂e
- Reinforcement share
- 20.21 %
- Per unit volume of element
- 287.47 kgCO₂e/yd³
- Saving against 100% Portland
- 0 kgCO₂e
- Reinforcement mass
- 11,040.38 lb
They open the calculator with your figures already in it
Embodied Carbon in Concrete Calculator: 18,829 kgCO₂e — shown in imperial, US market. The link sets both, so the result they see is the one on your screen.
Show calculation logicHide calculation logic
How this was calculated
Formula source(s)
- EN 15804 modules A1-A3 define cradle-to-gate: raw material supply, transport to the plant, and manufacturing
- Typical GWP ranges for structural concrete are drawn from published EPDs and the ICE database; product-specific EPDs vary widely around them
- Cement clinker is the dominant contributor — roughly 90% of a plain concrete's A1-A3 figure comes from the Portland cement fraction
Inputs used
- Concrete volume
- 65.5 yd³
- Mix and cement replacement
- C30/37, 100% Portland cement (~300 kgCO₂e/m³)
- Custom factor (kgCO₂e/m³)
- 0
- Reinforcement
- 168.56 lb/yd³
- Reinforcement factor (kgCO₂e/kg)
- 0.76
Intermediate steps
- Tonnes CO₂e
- 18.83 tCO₂e
- Concrete
- 15,023.5 kgCO₂e
- Reinforcement
- 3,805.95 kgCO₂e
- Reinforcement share
- 20.21 %
- Per unit volume of element
- 287.47 kgCO₂e/yd³
- Saving against 100% Portland
- 0 kgCO₂e
- Reinforcement mass
- 11,040.38 lb
Confidence note: Emission factors here are typical published ranges for orientation, not product data. A reportable assessment uses the supplier's own Environmental Product Declaration — the spread between two suppliers of the same nominal product routinely exceeds 30%.
What this calculation does not cover
- Cradle-to-gate only (A1-A3). Transport to site (A4), site operations (A5), the in-use stage and end of life are excluded, and A4 alone can be significant for a remote site.
- Excludes formwork, which is reused a variable number of times and is genuinely difficult to allocate.
- Does not credit carbonation over the structure's life, which reabsorbs a modest fraction of the process emissions and is treated inconsistently between assessment methods.
Add the equipment this sizes
This result is a specification — 19,000 kgCO₂e — not a quantity. Put the thing it sizes into your project: how many, what you call it, and your supplier’s price.
Computed in your browser — nothing you enter is uploaded. Presented in US customary units and US trade terminology. Where a formula follows a published standard, that standard and its edition are cited beside it on this page; where none governs, the page says so. Local amendments override model codes — verify against the code in force where you build.
Sources checked 2026-09-05 · in the site-wide review of 2026-09-06 · v1.1.1
Regulatory standards & verification citations3
- EN 15804 modules A1-A3 define cradle-to-gate: raw material supply, transport to the plant, and manufacturing
- Typical GWP ranges for structural concrete are drawn from published EPDs and the ICE database; product-specific EPDs vary widely around them
- Cement clinker is the dominant contributor — roughly 90% of a plain concrete's A1-A3 figure comes from the Portland cement fraction
Cite this page
Your workspace
Most jobs need more than one number. Add the calculators you need next and they open right here, underneath this one — your figures stay on screen and nothing is lost to a page change.